Antlion / Components / C-value Legend
C-value LegendLEGEND-001
Builds an explicit color legend for the C-value maps. Set the first number, the last number and the band size - the bands become <min, min to min+step, ... , >=max, each with its own color. Leave colors unwired for the built-in ramp, or supply your own (interpolated when fewer than the band count). Wire scheme into C-value Seat or C-value Tread; the map is then colored by these bands and C-value Map prints this legend on every sheet. Detail Mode on lists the two view-cut states (a seat row or a railing hiding the focal point, C<0) in their own colors; off folds them into the lowest band. It also carries the not-graded states - OPEN, FRONT, EMPTY and NA - as a fixed gray series, so every gray patch on the map is named on the sheet; the report output explains why each state appears and how to clear it. The component itself shows the legend on the canvas.
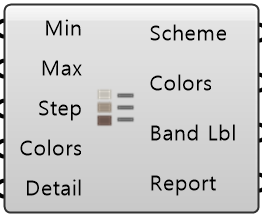
Colored ports carry the chain from one component to the next. The rest are values you set once.
Inputs
- Band Min
MinFirst band boundary. Everything below it forms the first band (default 60 mm) - Band Max
MaxLast band boundary. Everything at or above it forms the last band (default 200 mm) - Band Step
StepBand size. Bands run from Band Min upward to Band Max (default 10 mm) - Colors
ColorsYour own band colors, low band first. Fewer than bands = interpolated - Detail Mode
DetailThe C-value bands stay the same either way. On = the two view-cut states (seat row or railing hiding the focal point, C<0) get their own colors and legend rows. Off = they are folded into the lowest band color (default on)
Outputs
- Scheme
SchemeThe legend as one object. Wire into the Color Scheme input of a C-value map - Colors
ColorsThe color of each band, low band first - Band Labels
Band LblThe label of each band, as text - Report
ReportWhy the gray not-graded states appear and how to clear them
- Component
- LEGEND-001
- Ribbon
- Util
- Tier
- free
- Ports
- 5 in · 4 out
- Version
- 1.0.11
- Checked
- 2026-10-08