Antlion / Components / C-value Tread
C-value TreadANALYSIS-005
Paints each tread band with the C-value of one representative section taken between two axes. One value per axis gap, so it is light enough to leave on while you tune the section. C-value Seat measures every seat instead - the two differ most on curves, where one section cannot stand for the whole band.
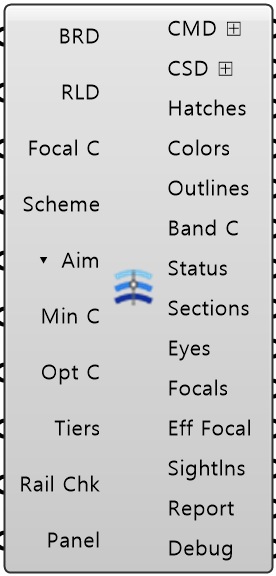
Colored ports carry the chain from one component to the next. The rest are values you set once. Inputs marked ▾ take a Value List: wire one in and it fills with the choices. Outputs marked ⊞ can go into Table Out, which writes them to a spreadsheet.
Inputs
- Build Result
BRDThe built bowl from Stand 3D Plus - or Rail 3D's Rail Result, which carries it. Merge several into one branch and they are checked as one bowl - Rail Result
RLDRailings from Rail 3D - their exact built tops, the front row's included. Unwired, railings are not checked (orange warning) - the first row and the seats behind railings get no railing value. Merge several to match the bowls above - Focal Curve
Focal CThe line every band aims at. Wire Field's Focal Curve, or draw your own - Color Scheme
SchemeA scheme from C-value Legend - it decides the colors and prints on every sheet. Unwired, the code's four steps are used and no legend prints - Focal Aim Mode
▾ AimWhich point on the pitch each band is measured against. THROUGH_CORNER walks the boundary to the first point the row in front hides, so corners come out right on a closed bowl. PERPENDICULAR takes the point straight ahead of the band's section, at the focal line's real height - use it on open stands and on a focal line that rises and falls, like a ballpark's infield to outfield (default THROUGH_CORNER) - Minimum C-Value
Min CBands below this are POOR. Leave it empty to judge each tier by the value its section was designed for (Table Section min_c_value, Auto Section Minimum C-Values; 90 mm if the section has none). 60 mm tolerable, 90 mm good, 120 mm excellent - Optimal C-Value
Opt CUpper end of the published band. Bands above it are drawn blue (default 120 mm) - Tier Enabled
TiersWhich tiers to build - one per tier, empty = every tier (default true) - Rail Check
Rail ChkCount railings and vomitory walls as sightline obstructions - the walls come with the build result, so they count without Rail Result too. Off = ignore them all, as if none were built (default on) - Panel Values
PanelEvery value from Input Panel, as one bundle. Anything you wire in yourself wins over it
Outputs
- C-value Map Data
CMD ⊞The whole tread map flattened to 2D plan. Feed it to C-value Map for sheets - C-value Section Data
CSD ⊞Every axis section in one bundle. Feed it to C-value Section Check for sheets - Map Hatches
HatchesOne branch per tier. One hatch per tread cell - the tread between two axes, in one row - Cell Colors
ColorsOne branch per tier. Wire into Custom Preview to override how the map is drawn - Cell Outlines
OutlinesOne branch per tier. Check here that the cells break on the axis lines - Band C-Values
Band COne branch per tier. Negative means the view is cut, NaN means no value - Band Statuses
StatusOne branch per tier. OK / POOR / BLOCKED / FRONT / EMPTY / NA - EMPTY is a row cell with no seat in it, so nothing is measured there - Band Sections
SectionsOne branch per tier. The section actually measured - the evidence behind the colors - Band Eyes
EyesOne branch per tier. The notional eye each band value was measured from - Band Focals
FocalsOne branch per tier. The focal point each band value was measured to - Effective Focal Curves
Eff FocalOne branch per tier. The same curve C-value Seat draws, built from band focals - Sightlines
SightlnsOne branch per tier. The section being measured, drawn - Report
ReportPer-tier summary plus how well one section represents each band - Debug
DebugDeveloper diagnostic output for tracking down bugs. Copy this when reporting a problem
What it does
Railings - vomitory walls included - count the same way as in C-value Seat: whichever of the row in front and a railing leaves the least clearance sets the cell's value, a railing the view clears by more than Optimal C-Value does not count while there is a row in front, a railing on another tier whose lowest tread is higher than the sightline is overhead and left out, and near a corner a railing that blocks the view to a focus outside the field counts only if it also blocks the view to the nearest point of the field. In the front row, with nothing else in front, a railing or wall of the cell's own tier sets the value whatever the clearance; one of another tier counts only when the view clears it by less than Optimal C-Value. Where a vomitory opening takes up the middle of a band, the band's front row is measured at the nearest seats of that row rather than over the open passage, against the railing built in front of them. Where a band's center line crosses none of the treads a cut has left in a tier, that tier's cells in the band are NA - no value - rather than a value measured where there is no tread, and the band's section leaves that tier out; a white remark lists those bands, and C-value Seat still gives every seat there its own value.
- Component
- ANALYSIS-005
- Ribbon
- Bowl Analysis
- Tier
- core
- Ports
- 10 in · 14 out
- Version
- 1.0.11
- Checked
- 2026-10-08