Antlion / Components / C-value Section Check
C-value Section CheckANALYSIS-006
Lays every axis section out on its own sheet so you can flip through them. One scale for the whole set, chosen so the largest section fits, and every section sits at the same place on its sheet.
1Plan & setup
2Section
32D layout
43D solids
5Analysis
Fig. 1 — PortsReads left, writes right
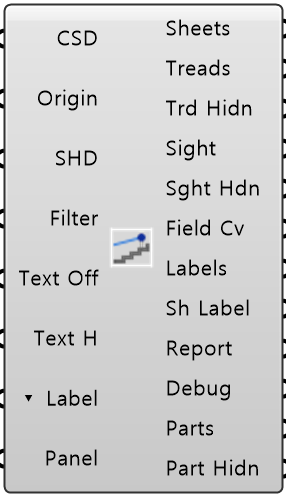
C-value Section Data CSDObject · itemThe section bundle from C-value Tread
Origin Point · itemBottom-left corner of the first sheet
Sheet Data SHDObject · itemPaper size, columns, scale rounding, margins and text style from Sheet Setup
Axis Filter FilterInteger · listDraw only these axis numbers
Text Offset Text OffNumber · itemHow far the dimension lines sit from the geometry
Text Height Text HNumber · itemText height as drawn
Label Mode ▾ LabelText · itemC_ONLY, C_AND_TR adds tread and riser, NONE draws none
Panel Values PanelObject · itemEvery value from Input Panel, as one bundle
Sheets Curve · listOne sheet rectangle per axis, sized so the drawing inside stays full size
Tread Curves TreadsCurve · listThe stand where the tread is really built, one closed curve per run
Tread Hidden Curves Trd HidnCurve · listThe stand where nothing is built
Sight Lines SightCurve · listEye to focal point, one per row that has a spectator
Hidden Sight Lines Sght HdnCurve · listSightlines for rows the cut does not pass through
Field Curves Field CvCurve · listThe drawing datums
Labels Geometry · listC-value and tread dimensions plus the sheet title, as real Rhino annotations
Sheet Labels Sh LabelText · listThe axis label on each sheet, parallel to Sheets
Report Text · listSheet format, scale, and how the largest section fits the usable area
Debug Text · itemDeveloper diagnostic output for tracking down bugs
Part Curves PartsCurve · listRailings and vomitories where the cut really passes through them, one curve per piece
Part Hidden Curves Part HidnCurve · listThe same parts where the cut misses them
Colored ports carry the chain from one component to the next. The rest are values you set once. Inputs marked ▾ take a Value List: wire one in and it fills with the choices.
Inputs
- C-value Section Data
CSDThe section bundle from C-value Tread. One wire is all this component needs - Origin
OriginBottom-left corner of the first sheet. Give each sheet component its own Default World origin. - Sheet Data
SHDPaper size, columns, scale rounding, margins and text style from Sheet Setup - Axis Filter
FilterDraw only these axis numbers - as many as you need. A sheet is named after the two axes it sits between, so sheet A8-9 is picked by typing 8 (the number it starts at); stands facing several ways get S1, S2 and so on in front, and 8 picks A8-9 on each. Clear it to lay out the whole set - Text Offset
Text OffHow far the dimension lines sit from the geometry (default 100 mm) - Text Height
Text HText height as drawn - the sheet scale is never applied to it (default 50 mm) - Label Mode
▾ LabelC_ONLY, C_AND_TR adds tread and riser, NONE draws none (default C_ONLY) - Panel Values
PanelEvery value from Input Panel, as one bundle. Anything you wire in yourself wins over it
Outputs
- Sheets
SheetsOne sheet rectangle per axis, sized so the drawing inside stays full size - Tread Curves
TreadsThe stand where the tread is really built, one closed curve per run. Draw solid - Tread Hidden Curves
Trd HidnThe stand where nothing is built - what a vomitory took out. Draw dashed - Sight Lines
SightEye to focal point, one per row that has a spectator. Draw solid - Hidden Sight Lines
Sght HdnSightlines for rows the cut does not pass through. Draw dashed - Field Curves
Field CvThe drawing datums - field line at focal height, focal point circle and cross - Labels
LabelsC-value and tread dimensions plus the sheet title, as real Rhino annotations - Sheet Labels
Sh LabelThe axis label on each sheet, parallel to Sheets - Report
ReportSheet format, scale, and how the largest section fits the usable area - Debug
DebugDeveloper diagnostic output for tracking down bugs. Copy this when reporting a problem - Part Curves
PartsRailings and vomitories where the cut really passes through them, one curve per piece. Draw solid - these are real sections, not datums - Part Hidden Curves
Part HidnThe same parts where the cut misses them. Draw dashed
- Component
- ANALYSIS-006
- Ribbon
- Bowl Analysis
- Tier
- core
- Ports
- 8 in · 12 out
- Version
- 1.0.11
- Checked
- 2026-10-08