Antlion / Components / C-value Map
C-value MapANALYSIS-007
Lays the C-value map out flat - one sheet per tier, named TIER 1, TIER 2 and so on, with the seat layout drawing, the colored map and the tier's minimum, average and pass rate written top-left. In a bowl merged from several stands, tiers with the same tier label share one sheet named after it - by default that is the same tier number in each stand, or give Table Section tier_label values such as LOW. Wire the CMD output of C-value Seat for a seat map, or of C-value Tread for a tread map - one at a time.
1Plan & setup
2Section
32D layout
43D solids
5Analysis
Fig. 1 — PortsReads left, writes right
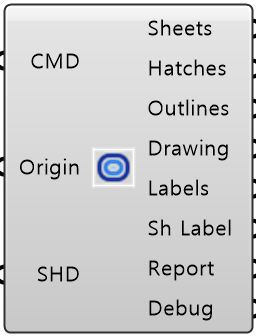
C-value Map Data CMDObject · listThe map bundle from C-value Seat or C-value Tread
Origin Point · itemBottom-left corner of the first sheet
Sheet Data SHDObject · itemPaper size, columns, scale rounding, margins and text style from Sheet Setup
Sheets Curve · listOne sheet rectangle per tier
Map Hatches HatchesHatch · listThe colored map on the sheets, one hatch per cell
Map Outlines OutlinesCurve · listThe curve each hatch on the map was made from
Drawing Curves DrawingCurve · listThe seat layout drawing on each sheet, flat on Z=0
Labels Geometry · listSheet titles as real Rhino text
Sheet Labels Sh LabelText · listThe name on each sheet
Report Text · listSheet format, scale, what was drawn and the conventions used
Debug Text · itemDeveloper diagnostic output for tracking down bugs
Colored ports carry the chain from one component to the next. The rest are values you set once.
Inputs
- C-value Map Data
CMDThe map bundle from C-value Seat or C-value Tread. Wire exactly one - Origin
OriginBottom-left corner of the first sheet. Give each sheet component its own Default World origin. - Sheet Data
SHDPaper size, columns, scale rounding, margins and text style from Sheet Setup
Outputs
- Sheets
SheetsOne sheet rectangle per tier - merged stands' tiers with the same tier label share one - sized so the drawing inside stays full size - Map Hatches
HatchesThe colored map on the sheets, one hatch per cell. Bake it and the colors keep - Map Outlines
OutlinesThe curve each hatch on the map was made from - Drawing Curves
DrawingThe seat layout drawing on each sheet, flat on Z=0. Draw thin - Labels
LabelsSheet titles as real Rhino text - the sheet's name, then minimum, average and pass rate - Sheet Labels
Sh LabelThe name on each sheet - TIER n, or a tier label that merged stands share - parallel to Sheets - Report
ReportSheet format, scale, what was drawn and the conventions used - Debug
DebugDeveloper diagnostic output for tracking down bugs. Copy this when reporting a problem
- Component
- ANALYSIS-007
- Ribbon
- Bowl Analysis
- Tier
- core
- Ports
- 3 in · 8 out
- Version
- 1.0.11
- Checked
- 2026-10-08