Antlion / Components / Seat Map
Seat MapSEATMAP-001
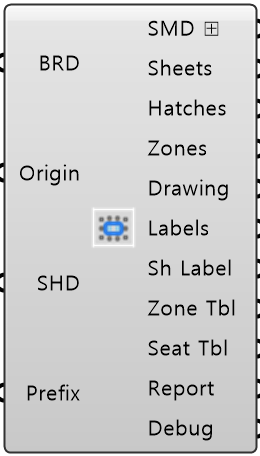
Groups the seats into zones - the pieces left when the aisles, vomitories and cuts are taken out of the tier - and gives every seat a readable address like "T1 05 S 25": prefix and tier number, zone number counted around the bowl in the axis direction, then the seat number running from the lowest tread up. In a bowl merged from several stands, tiers with the same tier label - by default the same tier number in each stand - count as one tier: one number, one run of zones around the bowl, one sheet. Wheelchair units belong to their zone too, numbered "W 1", "W 2". Outputs the SMD bundle for Seat View and Seat 3D, a zone map laid out one sheet per tier, and flat tables ready for a spreadsheet. Wire the BRD output of Stand 3D Plus; wire SHD from Sheet Setup to place the sheets
Colored ports carry the chain from one component to the next. The rest are values you set once. Outputs marked ⊞ can go into Table Out, which writes them to a spreadsheet.
Inputs
- Build Result
BRDThe build result from Stand 3D Plus - the seats after every cut, with tiers and rows. Merge several into one branch and they are numbered as one bowl - Origin
OriginBottom-left corner of the first sheet. Give each sheet component its own Default World origin. - Sheet Data
SHDPaper size, columns, scale rounding, margins and text style from Sheet Setup - Zone Prefix
PrefixThe letter in front of every zone label - T and tier 1 give T1 01 (default T)
Outputs
- Seat Map Data
SMD ⊞Zones with their statistics, plus every seat's zone, number and address - Sheets
SheetsOne sheet rectangle per tier - merged stands' tiers with the same tier label share one - sized so the drawing inside stays full size - Zone Hatches
HatchesOne pastel hatch per zone - neighboring zones get different colors - Zone Outlines
ZonesThe boundary of each zone on the sheets - Drawing Curves
DrawingThe seat layout drawing on each sheet, flat on Z=0. Draw thin - Labels
LabelsZone labels, seat counts and sheet titles as real Rhino text - Sheet Labels
Sh LabelThe name on each sheet - TIER n, or a tier label that merged stands share - parallel to Sheets - Zone Table
Zone TblOne tab-separated line per zone with a header row. Paste into a spreadsheet - Seat Table
Seat TblOne tab-separated line per seat. Built only while something is wired here - Report
ReportZone-by-zone summary you can read like a legend - Debug
DebugDeveloper diagnostic output for tracking down bugs. Copy this when reporting a problem
- Component
- SEATMAP-001
- Ribbon
- Bowl Analysis
- Tier
- core
- Ports
- 4 in · 11 out
- Version
- 1.0.11
- Checked
- 2026-10-08