Antlion / Components / Section analysis
Section analysisANALYSIS-001
Checks the sightline over the row in front, row by row, and reports the C-value. Draws the sightlines and dimensions so you can see where the view fails.
1Plan & setup
2Section
32D layout
43D solids
5Analysis
Fig. 1 — PortsReads left, writes right
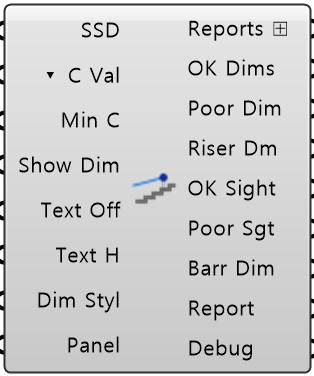
Stand Sections SSDObject · listThe sections to check, from Section or Section Plus
C-Value Mode ▾ C ValText · itemSTANDARD aims straight at the focal point, VARIABLE_CORNER allows for the corners
Minimum C-Value Min CNumber · itemRows below this are reported POOR
Show Dimensions Show DimBoolean · itemDraw the dimension annotations
Text Offset Text OffNumber · itemHow far the dimension lines sit from the geometry
Text Height Text HNumber · itemDimension text height
Dimension Style Dim StylObject · itemA Rhino dimension style to draw with
Panel Values PanelObject · itemEvery value from Input Panel, as one bundle
Analysis Reports Reports ⊞Object · listThe full result per tier
OK Dimensions OK DimsGeometry · listC-value dimensions for rows that pass
Poor Dimensions Poor DimGeometry · listC-value dimensions for rows that fail
Riser Dimensions Riser DmGeometry · listRiser height dimension on each step
OK Sightlines OK SightCurve · listSightlines for rows that pass, plus each tier's last row
Poor Sightlines Poor SgtCurve · listSightlines for rows that fail
Barrier Dimensions Barr DimGeometry · listC-value dimension at the barrier top point
Report Text · listPer-tier summary
Debug Text · itemDeveloper diagnostic output for tracking down bugs
Colored ports carry the chain from one component to the next. The rest are values you set once. Inputs marked ▾ take a Value List: wire one in and it fills with the choices. Outputs marked ⊞ can go into Table Out, which writes them to a spreadsheet.
Inputs
- Stand Sections
SSDThe sections to check, from Section or Section Plus. One branch per tier - C-Value Mode
▾ C ValSTANDARD aims straight at the focal point, VARIABLE_CORNER allows for the corners (default STANDARD) - Minimum C-Value
Min CRows below this are reported POOR. Leave it empty to judge each section by the value it was designed for (Table Section min_c_value, Auto Section Minimum C-Values; 90 mm if the section has none). 60 mm tolerable, 90 mm good, 120 mm excellent - Show Dimensions
Show DimDraw the dimension annotations. Off = faster solve when you only want numbers (default true) - Text Offset
Text OffHow far the dimension lines sit from the geometry (default 100 mm) - Text Height
Text HDimension text height (default 50 mm) - Dimension Style
Dim StylA Rhino dimension style to draw with. Leave unwired for the default - Panel Values
PanelEvery value from Input Panel, as one bundle. Anything you wire in yourself wins over it
Outputs
- Analysis Reports
Reports ⊞The full result per tier - C-value per row, pass/fail and the warnings behind them - OK Dimensions
OK DimsC-value dimensions for rows that pass - Poor Dimensions
Poor DimC-value dimensions for rows that fail - these are the rows to fix - Riser Dimensions
Riser DmRiser height dimension on each step - OK Sightlines
OK SightSightlines for rows that pass, plus each tier's last row - Poor Sightlines
Poor SgtSightlines for rows that fail - look here first - Barrier Dimensions
Barr DimC-value dimension at the barrier top point - Report
ReportPer-tier summary - rows, min and max C-value, pass rate - Debug
DebugDeveloper diagnostic output for tracking down bugs. Copy this when reporting a problem
- Component
- ANALYSIS-001
- Ribbon
- Bowl Analysis
- Tier
- core
- Ports
- 8 in · 9 out
- Version
- 1.0.11
- Checked
- 2026-10-08